
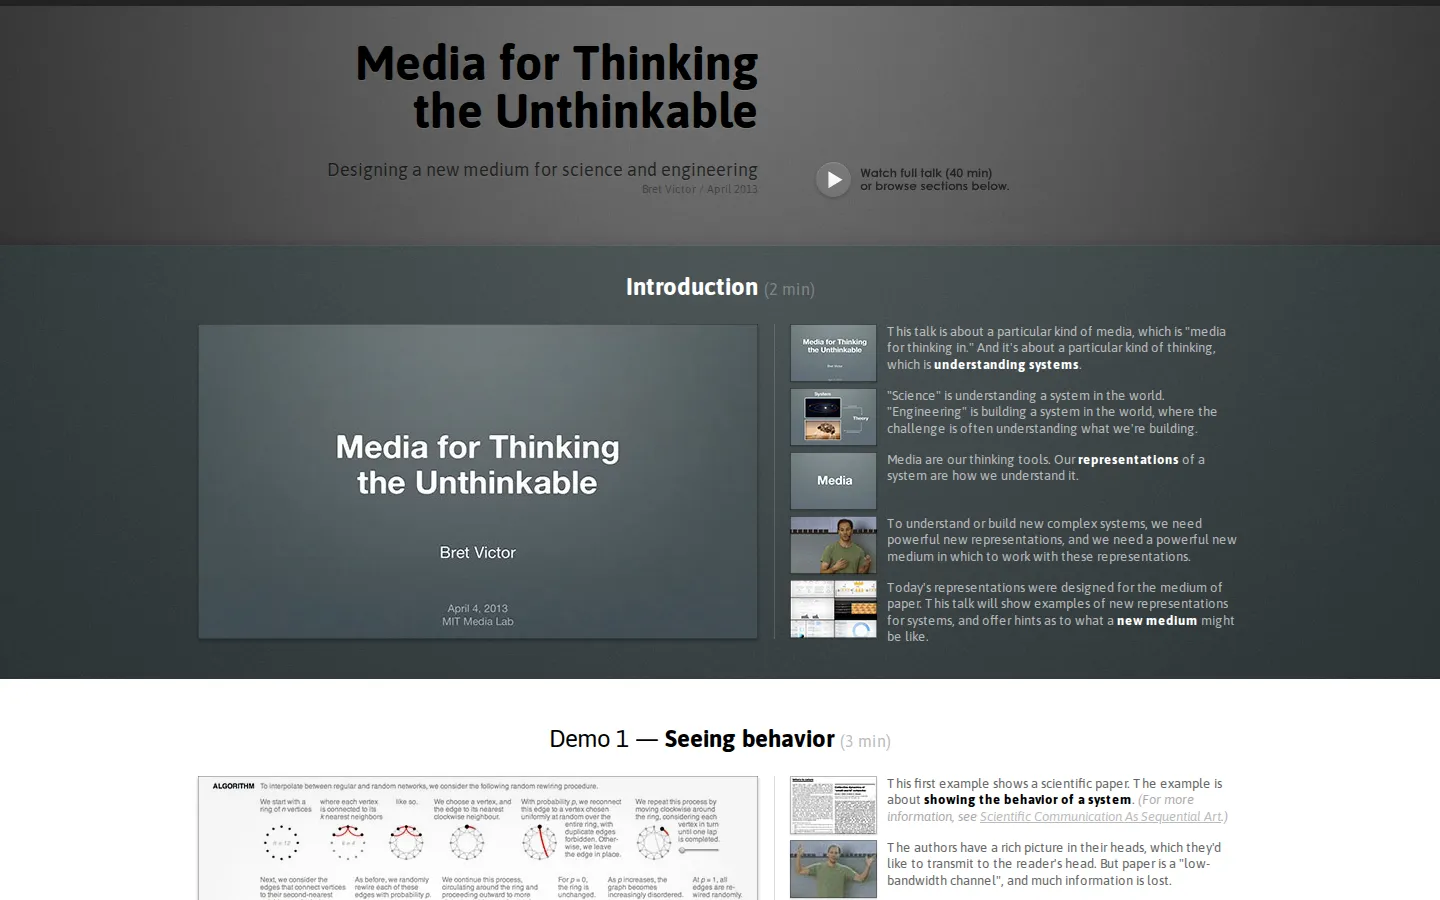
Bret Victor breaks a forty-minute MIT Media Lab talk into a browsable set of demonstrations about seeing complex systems. Instead of treating the video as one sealed brick, the page gives each idea its own timed window, concise explanation, and trail into related work.
What is Media for Thinking the Unthinkable?
The tour moves through six different laboratories for thought. A scientific paper pairs algorithm steps with visible behavior. A circuit view replaces one-at-a-time measurements with simultaneous voltages and currents. Signal-processing and difference-equation tools link several interpretations of the same system, while a graphics pipeline traces each object through code and transformations. The final demo asks how custom visualizations might be drawn directly and still respond to data. Those prototypes serve a larger question: computers inherited too many representations from paper. Victor's proposed alternative is not a single application but a medium where structure, behavior, and manipulation stay in view together. The page quietly applies that argument to the talk itself, turning linear video into a cabinet of labeled specimens.
What you can do there
- Skim timed summaries of six demonstrations
- Play chapters about visual tools for understanding systems
- Compare examples from scientific papers, circuits, signals, equations, and graphics
Why we picked it
The demonstrations make a broad design philosophy unusually concrete, and the digest format respects readers who want to inspect one idea without replaying an entire lecture. It is especially good at showing that an interface can reveal more than a final output: it can expose relationships, intermediate states, and the behavior that normally disappears behind symbols.
How to get the most from it
Start with the two-minute introduction, then sample the circuit and linked-representation sections before deciding whether to watch straight through. Keep the section summaries nearby as a map; they make it easy to return to a particular prototype or follow its related project link later.
Good to know
The talk was presented on April 4, 2013 and publicly released that May. The page embeds video, so sound is useful for full playback, but its written chapter summaries provide a quieter route through the main sequence. Current player, caption, mobile, and accessibility behavior may vary, and the favicon still awaits verification.
Who made it, and when?
Bret Victor is the credited creator or organization. The earliest supported launch date we found is May 28, 2013.
Creator’s official page Open Media for Thinking the UnthinkableMore like this
Nicky Case

Playable explanations about trust, systems, anxiety, networks, and the way people affect one another.
The Illustrated TLS Connection

TLS, unpacked until the handshake has nowhere left to hide.
Learn Git Branching

Git’s family tree, finally allowed to move while you poke it.
How DNS Works

A DNS lesson that takes the scenic route through the internet