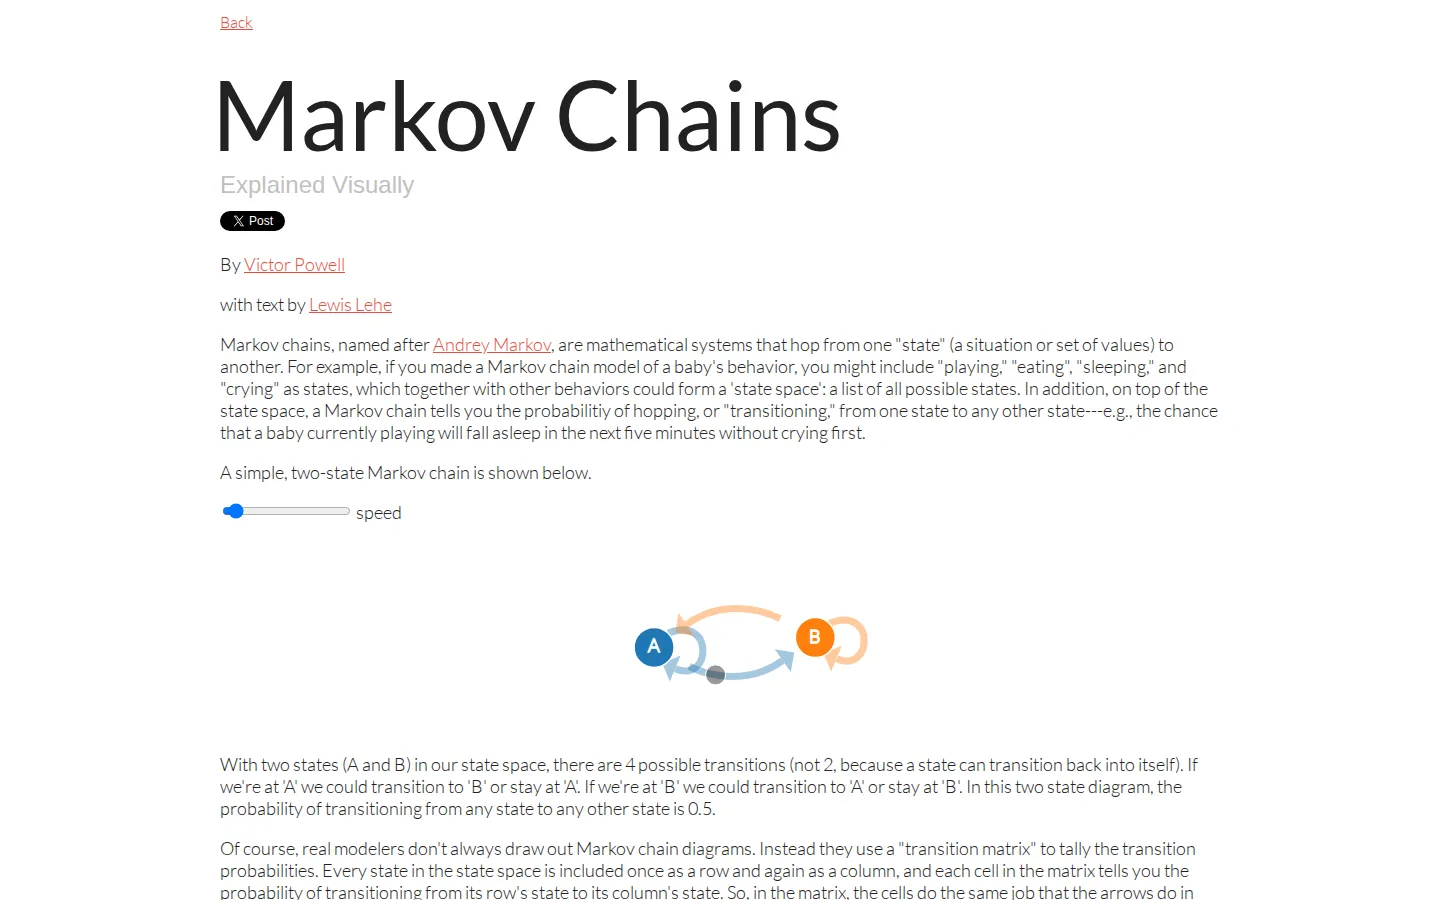
This compact visual lesson turns Markov chains into a sequence you can follow: first two states and their arrows, then transition matrices, sticky weather patterns, and finally a playground for building a chain of your own. It favors intuition over formal proof and keeps the mathematics attached to visible consequences.
What is Markov Chains Explained Visually?
The page begins with the smallest useful cast, states A and B, and shows that staying put counts as a transition too. A matching matrix translates those arrows into probabilities before the lesson shifts to rainy and sunny days, where repeated weather makes the idea of state dependence feel less abstract. The final playground invites a closer look at the machinery: edit a square transition matrix, start from a preset or random example, and watch for the built-in warning when the rows no longer describe valid probabilities. It is a tidy path from picture to notation to experiment, with very little ceremonial fog around the algebra.
What you can do there
- Follow animated state-and-transition examples
- Edit a transition matrix in the embedded playground
- Try presets or generate a random chain
Why we picked it
It finds a rare sweet spot between diagram and definition. The weather example gives the model a memorable bit of stickiness, while the editable matrix keeps the lesson from becoming a museum display. Independent educators and readers have pointed to the same strengths, and the page remains useful as a quick intuition-builder even though its underlying project is decidedly old-school web craft.
How to get the most from it
Read the first two-state example slowly enough to match every matrix cell with an arrow. At the weather section, compare the independent sequence with the stickier one before moving on. In the playground, begin with a preset, change one row at a time, and keep each row total at 1 so the result stays valid.
Good to know
The lesson is free to open and is aimed at intuition, not a complete course in stochastic processes. Expect JavaScript-dependent diagrams, motion, an embedded playground, a newsletter form, and a Disqus comment area. Keyboard, touch, reduced-motion, and screen-reader support are not documented, and the public source repository describes its development setup as outdated.
Who made it, and when?
Victor Powell and Lewis Lehe is the credited creator or organization.
Open Markov Chains Explained VisuallyMore like this
Nicky Case

Playable explanations about trust, systems, anxiety, networks, and the way people affect one another.
The Illustrated TLS Connection

TLS, unpacked until the handshake has nowhere left to hide.
Learn Git Branching

Git’s family tree, finally allowed to move while you poke it.
How DNS Works

A DNS lesson that takes the scenic route through the internet