
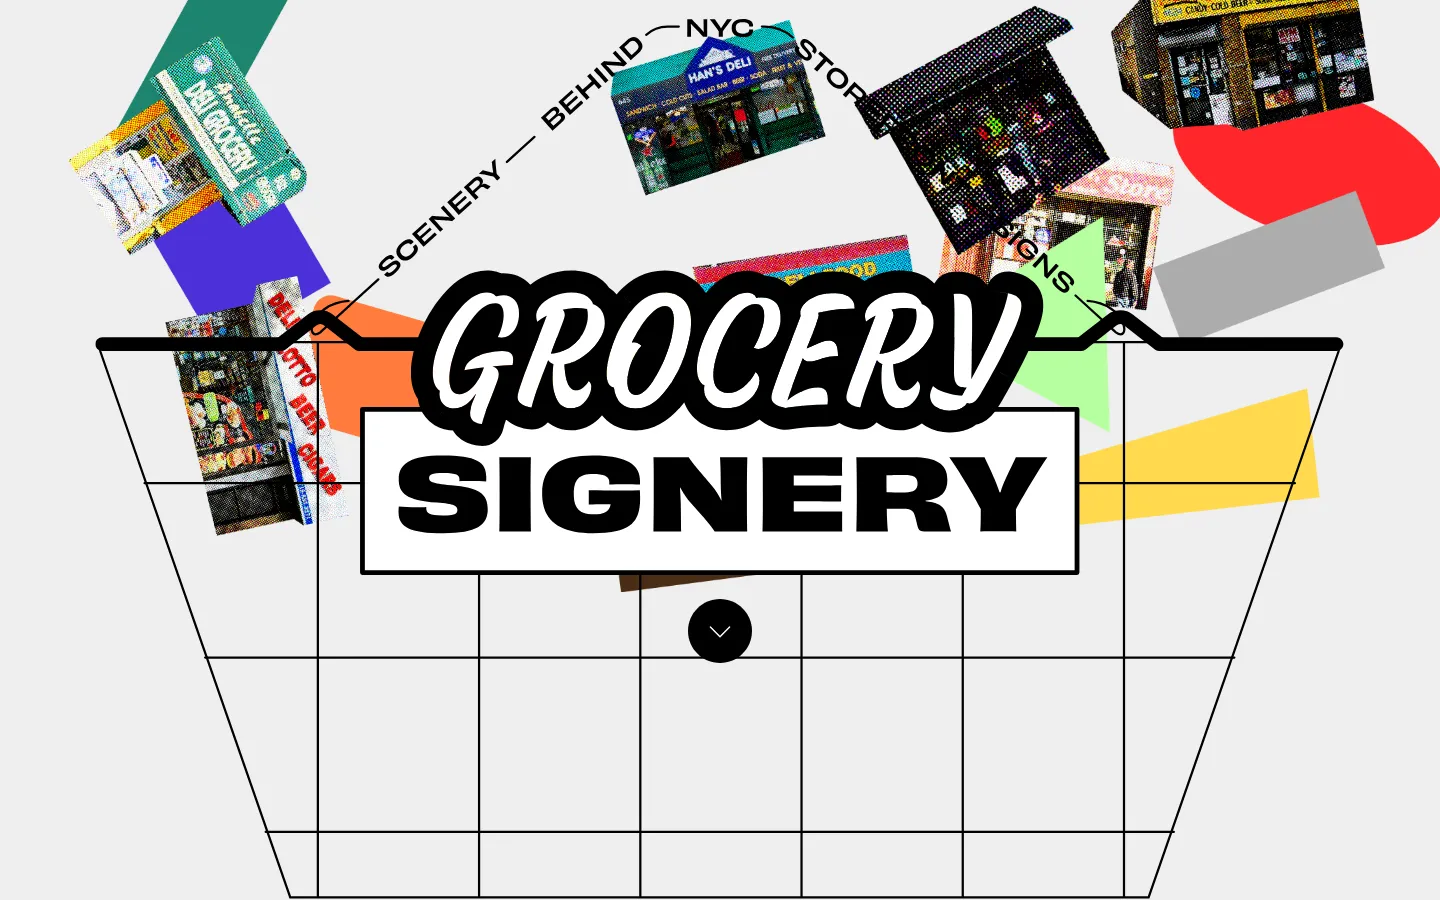
Grocery Signery reads New York's corner markets through their names, lettering, and colors, then gathers those patterns into a filterable neighborhood map. It is an observant data story about the storefront details most of us hurry past, though its demographic comparisons deserve to be read as descriptive patterns rather than causes.
What is Grocery Signery?
The story begins with words. Familiar bits of grocery names—fresh, stop, star, halal, family—become clues about convenience, aspiration, culture, and the way a shop introduces itself to the block. It then shifts to the signs themselves, comparing font families and recurring colors before organizing the material by neighborhood demographics. The final map brings those strands together with filters for income, race, generation, type style, and color. That progression turns an ordinary errand into a compact lesson in noticing: the awning above the apples is also a piece of local graphic design.
What you can do there
- Read the textual and visual analysis
- Filter the neighborhood map by demographic and sign attributes
Why we picked it
The subject is wonderfully specific, and the structure earns its interactive ending. By the time the neighborhood map appears, the earlier examples have supplied enough visual vocabulary to make filtering feel like investigation rather than button pressing. Independent recognition from The Pudding and the project's place in Parsons' data-visualization archive also make it more than a handsome one-off.
How to get the most from it
Read the word and type sections before jumping to the map; they explain what the filters are trying to reveal. On the map, change one dimension at a time, compare a few neighborhoods, and treat the results as prompts for closer looking rather than rankings or causal claims.
Good to know
This is a data story, not a grocery directory. Its live map behavior, responsive layout, accessibility, motion, and audio were not exercised in this review, and no screenshot was captured. The demographic groupings are descriptive project categories, so apparent relationships should not be read as explanations of a neighborhood or its residents.
Who made it, and when?
Monsicha Srisuantang is the credited creator or organization.
Creator’s official page Open Grocery SigneryMore like this
Histography

A dense timeline where eras collapse into a field of small historical sparks.
Steve's Old Computer Museum

A wonderfully dusty filing cabinet of computers from before beige boxes learned to hide their weirdness.
Wayback Machine

A time machine for webpages, complete with a calendar and the occasional missing wire.
Bartosz Ciechanowski

Science essays with levers, sliders, and a knack for making machinery behave.