
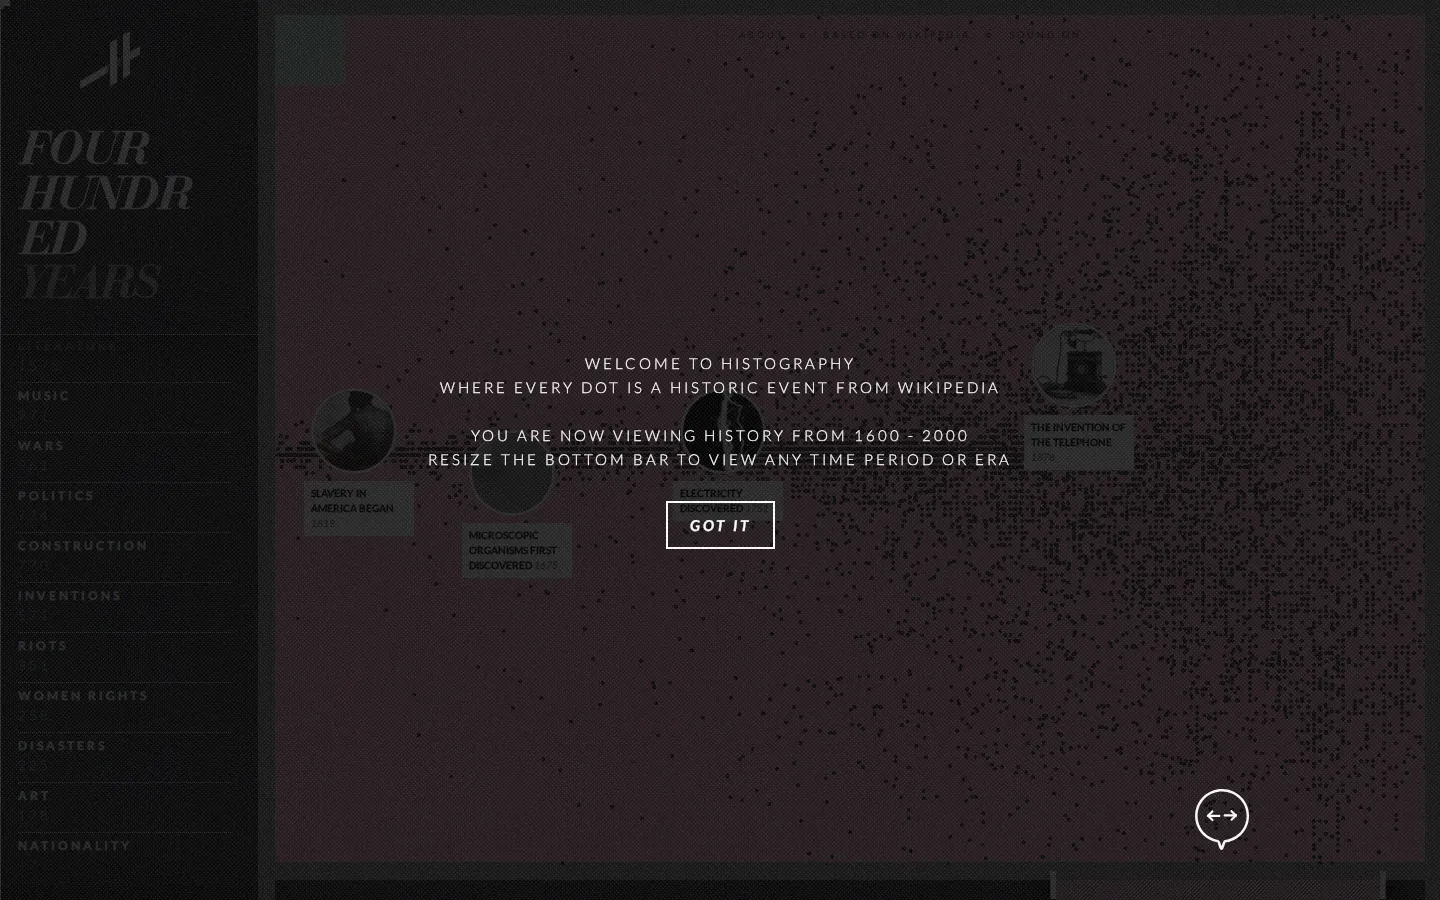
Histography turns an enormous span of history into a zoomable field of event dots. Start in a familiar century, tighten the time range at the bottom, or pick an era and let the interface tug you sideways through time.
What is Histography?
The opening view feels less like a textbook index than a wall of pinpricks waiting to be disturbed. Histography lets you narrow the visible slice of time, then brings selected events into a scrolling panel at the side. Its era shortcuts are useful when the full sweep feels too vast: choose a period, follow a few dots, and let the odd connections do the work. A random-start button is there for visitors who would rather be handed a historical rabbit hole than choose one. The project is built around Wikipedia-derived material, so it works best as a lively map of leads rather than the last word on any event.
What you can do there
- Browse historical events as dots
- Adjust the visible time range
- Choose an era or a random starting point
Why we picked it
It makes historical scale physical: a short adjustment can put a familiar decade beside stretches of time that barely fit in the head. The interface rewards aimless poking, but still offers enough rails to find a way in.
How to get the most from it
Begin with a period you recognize, then use the bottom range control to widen or narrow the view. Open a few nearby dots, scan the side panel, and switch eras when a connection starts to go cold. Save the random option for when you want a surprise.
Good to know
Histography identifies its event material as Wikipedia-based and labels itself beta. Treat its snippets as curiosity trails, not a citation-ready reference. It also shows a sound control and a visually busy moving layout, which may not suit every setting.
Who made it, and when?
Matan Stauber is the credited creator or organization.
Creator’s official page Open HistographyMore like this
Steve's Old Computer Museum

A wonderfully dusty filing cabinet of computers from before beige boxes learned to hide their weirdness.
Wayback Machine

A time machine for webpages, complete with a calendar and the occasional missing wire.
Bartosz Ciechanowski

Science essays with levers, sliders, and a knack for making machinery behave.
My 50s TV

A rabbit-ear detour into the age when television still felt handmade.