
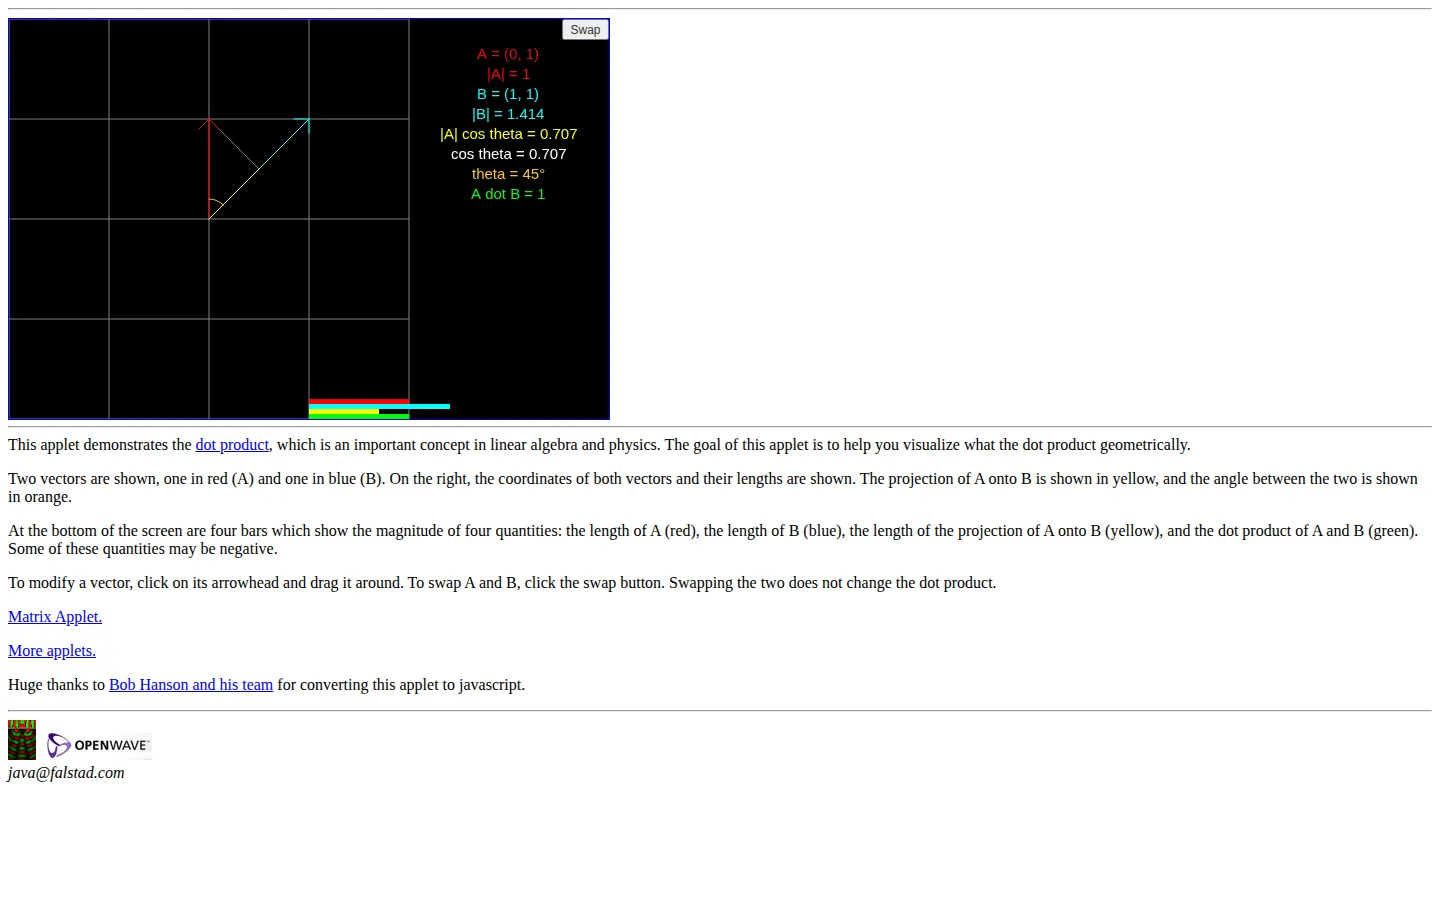
Dot Product puts two vectors, their angle, one projection, and the resulting scalar on the same compact stage. Dragging the documented arrowheads should make the signs and lengths feel less like algebraic bookkeeping and more like geometry you can interrogate.
What is Dot Product?
The page pairs a red vector A with a blue vector B, then marks A's projection in yellow and the angle between the pair in orange. Coordinates and lengths sit alongside bar-style readouts for both magnitudes, the projection, and the dot product. That synchronized layout is the useful trick: it lets one movement connect several representations of the same relationship. The instructions also provide a swap button, a neat little commutativity check because exchanging A and B leaves the scalar result unchanged.
What you can do there
- Drag two vectors and watch their dot product change
- Compare vector lengths, projection, angle, and scalar result
- Swap the vectors to see the operation's symmetry
Why we picked it
It isolates one famously abstract operation and gives every important quantity a visible role. The page is sparse, but that economy helps: there is little between the visitor and the moment when an obtuse angle pushes the result below zero or a right angle flattens it to zero.
How to get the most from it
Begin with the vectors pointing roughly together, then drag one through a right angle and onward in the opposite direction. Watch the green result cross zero while comparing the yellow projection. Finish by swapping A and B to check that the dot product stays put.
Good to know
This is a focused visualization, not a lesson sequence or proof. The written page is publicly accessible, but live interaction, mobile behavior, keyboard access, sound, and current browser quirks were not tested in the non-rendering check. No screenshot was captured.
Who made it, and when?
Paul Falstad is the credited creator or organization.
Creator’s official page Open Dot ProductMore like this
Nicky Case

Playable explanations about trust, systems, anxiety, networks, and the way people affect one another.
The Illustrated TLS Connection

TLS, unpacked until the handshake has nowhere left to hide.
Learn Git Branching

Git’s family tree, finally allowed to move while you poke it.
How DNS Works

A DNS lesson that takes the scenic route through the internet