
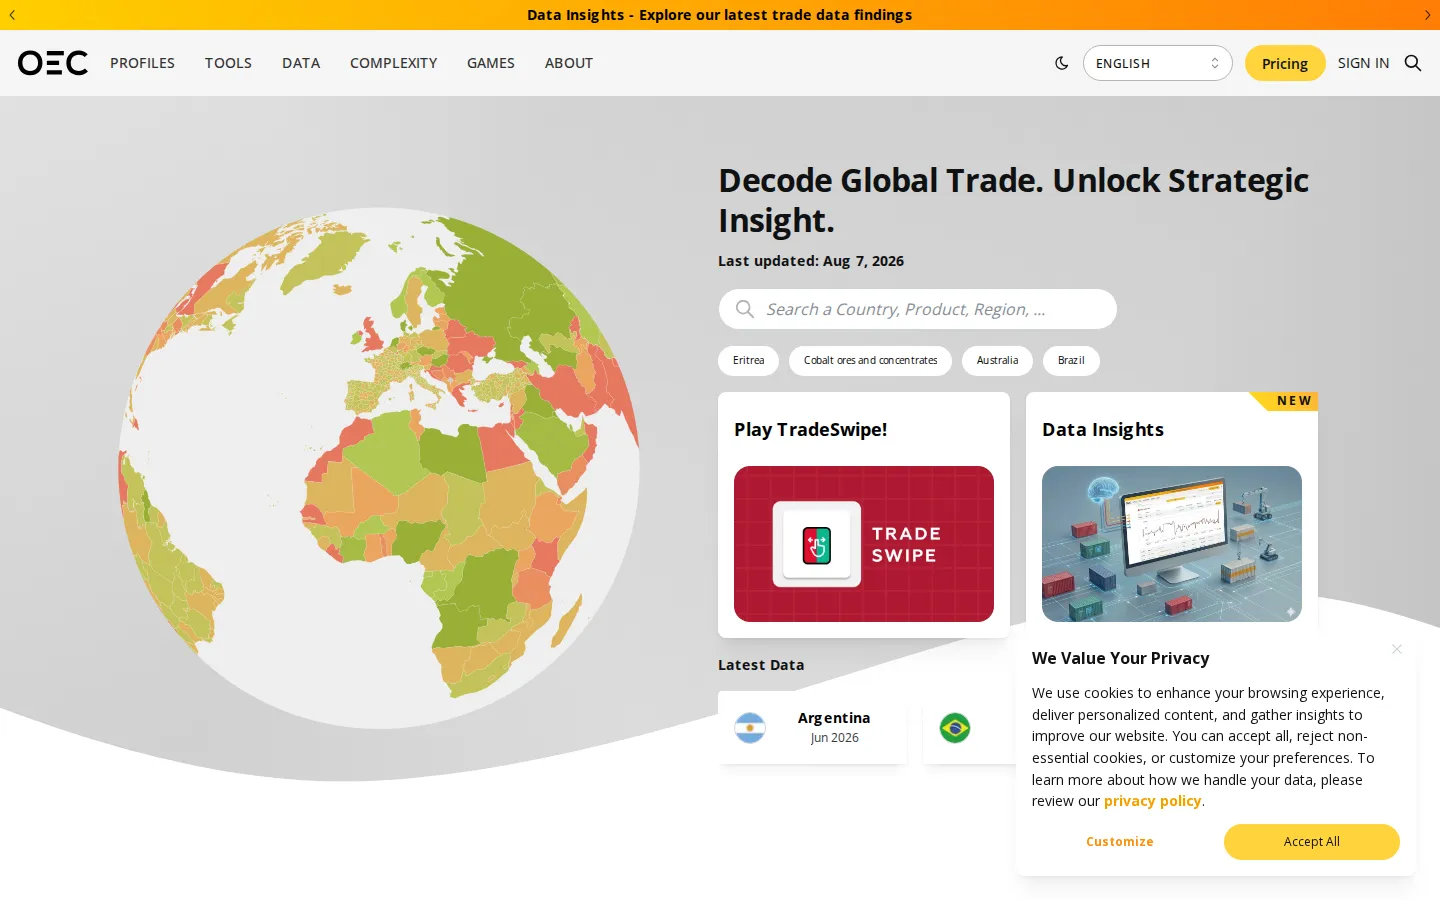
The Observatory of Economic Complexity turns international trade records into explorable country, product, partner, and complexity views. Its visualizer makes an enormous dataset feel like a sequence of plain questions, although newer and more granular material can require an account or paid tier.
What is The Observatory of Economic Complexity?
OEC is a telescope for customs tables. Choose a country, trading partner, dataset, flow, and time span, and the builder reframes those choices as a readable question before producing a visualization. The separate complexity rankings can be viewed as a table, chart, or map, which makes it easy to move from a broad comparison to a more pointed follow-up. The useful trick is to change one dimension at a time: hold the year steady while switching countries, or keep the country fixed while comparing products. That preserves the story behind the colors instead of turning the page into a very handsome blur of rectangles.
What you can do there
- Explore trade by country, partner, product, and year
- Build maps and charts from selected trade dimensions
- Compare economic and product complexity rankings
Why we picked it
Many trade databases begin with a download button and a prayer. OEC begins with questions people actually ask: what does a country export, where does it go, and how has that pattern changed? That question-led structure gives a forbidding subject an inviting front door without erasing the classifications and time choices that make the answer meaningful.
How to get the most from it
Start with one country and one recent year, then change only the product, partner, or trade-flow dimension. Use the rankings for orientation, not a final verdict. Before reusing a number, record the dataset, classification, units, year, and whether the view came from a free or premium source.
Good to know
Many historical trade and metadata API endpoints are available without authentication, while newer, subnational, higher-frequency, and larger-volume access may require Pro or Premium credentials. For consequential analysis, confirm figures against the named underlying source and check whether later revisions changed the result.
Who made it, and when?
Cesar A. Hidalgo and Alexander Simoes is the credited creator or organization.
Creator’s official page Open The Observatory of Economic ComplexityMore like this
The Pudding

Visual essays that use code, data, and interaction to explain culture unusually well.
Earth Nullschool

A living globe of wind, weather, ocean currents, and atmospheric motion.
The True Size Of…

Drag countries around the map and watch familiar size comparisons fall apart.
MapCrunch

Drop into a random street-level view somewhere in the world and figure out where you landed.