
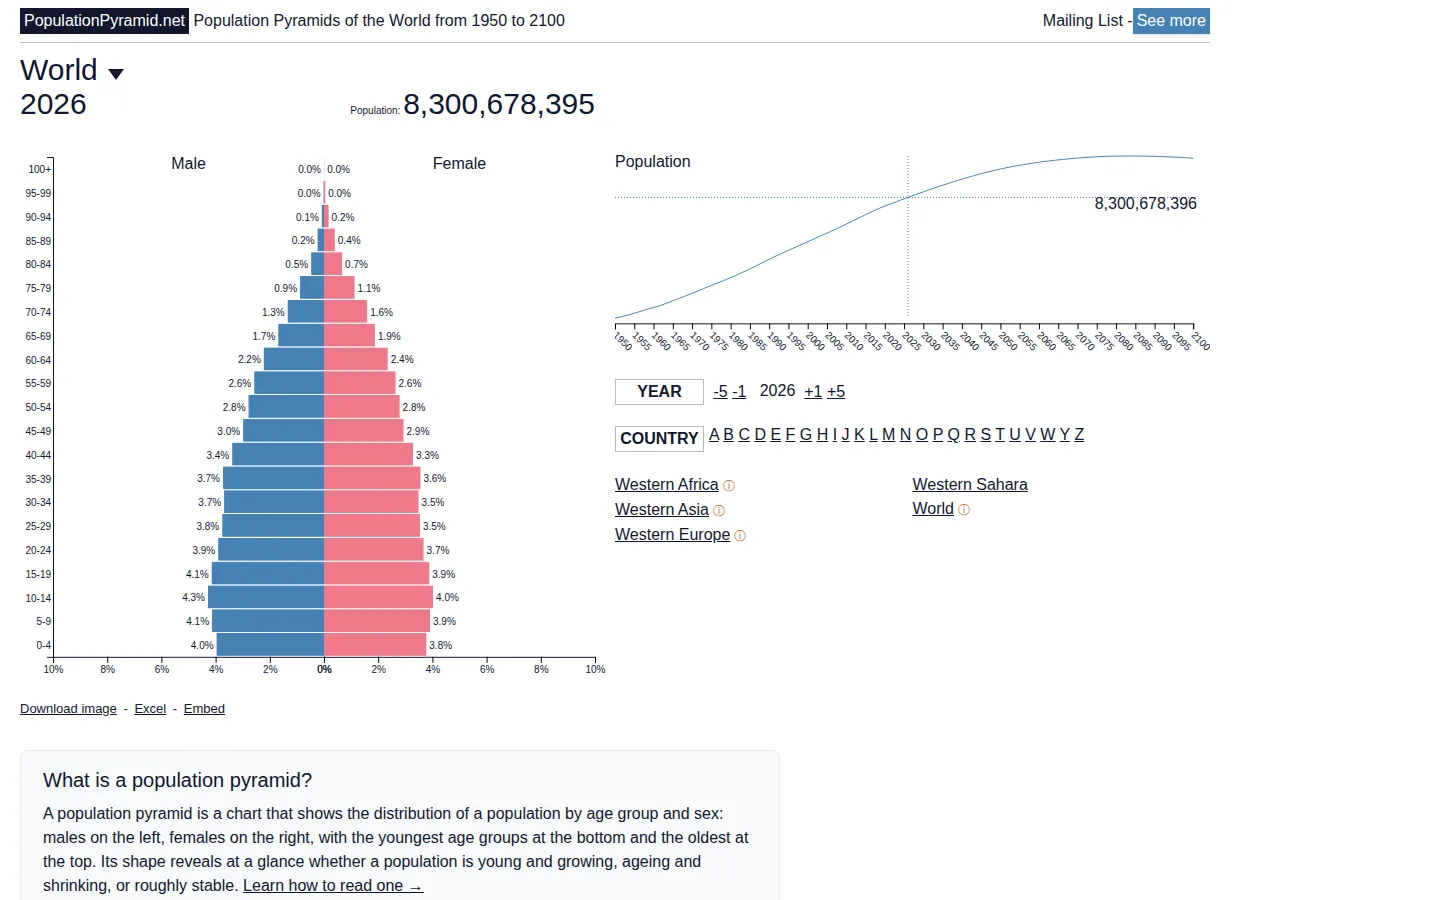
PopulationPyramid.net pairs country and region choices with yearly age-and-sex charts spanning 1950 to 2100. The current page adds a plain-language guide, headline demographic figures, and an embed option, making a dense UN dataset unusually approachable.
What is PopulationPyramid.net?
The homepage starts with the world in 2026, then surrounds the central population pyramid with routes to countries, regions, and years. Each chart is built to make age structure legible: males and females sit on opposite sides, younger groups begin at the bottom, and the silhouette reveals whether a population is expanding, steadying, or ageing. Historical estimates and medium-variant projections share the same 1950–2100 timeline, so a single place can be followed across generations without wrestling a spreadsheet. Explanatory statistics and links to migration, density, rankings, and growth maps turn the pyramid into a useful doorway rather than a lone infographic.
What you can do there
- Choose a country or region and a year
- Read age and sex structure in a population pyramid
- Embed a selected pyramid in another page
Why we picked it
It gives demographic change a memorable outline. The wide place list and consistent timeline support quick classroom examples, while the short explanation helps a curious visitor read the bars instead of merely admiring their symmetry.
How to get the most from it
Start with a place you know, open a past year, then jump several decades forward and watch for bulges moving upward through the age bands. Treat dates beyond the present as projections, and use the linked source material when a surprising shape deserves a closer look.
Good to know
No account is required, and the project is free to visit. Its owner says advertising supports the work, while the privacy policy documents cookies, Google Analytics, and third-party ad services. Future-year figures use the UN's medium projection variant, so they are informed estimates rather than a crystal ball.
Who made it, and when?
Martin De Wulf is the credited creator or organization. The earliest supported launch date we found is 2011.
Creator’s official page Open PopulationPyramid.netMore like this
The Pudding

Visual essays that use code, data, and interaction to explain culture unusually well.
Earth Nullschool

A living globe of wind, weather, ocean currents, and atmospheric motion.
The True Size Of…

Drag countries around the map and watch familiar size comparisons fall apart.
MapCrunch

Drop into a random street-level view somewhere in the world and figure out where you landed.