Benford's Law turns an odd statistical pattern into a patient visual tour: in many suitable real-world datasets, numbers beginning with 1 appear far more often than numbers beginning with 9. Schubert de Abreu builds the idea from examples, explains the logarithmic rule, and spends welcome time on where the pattern fails.
What is Benford's Law: A Visual Explainer?
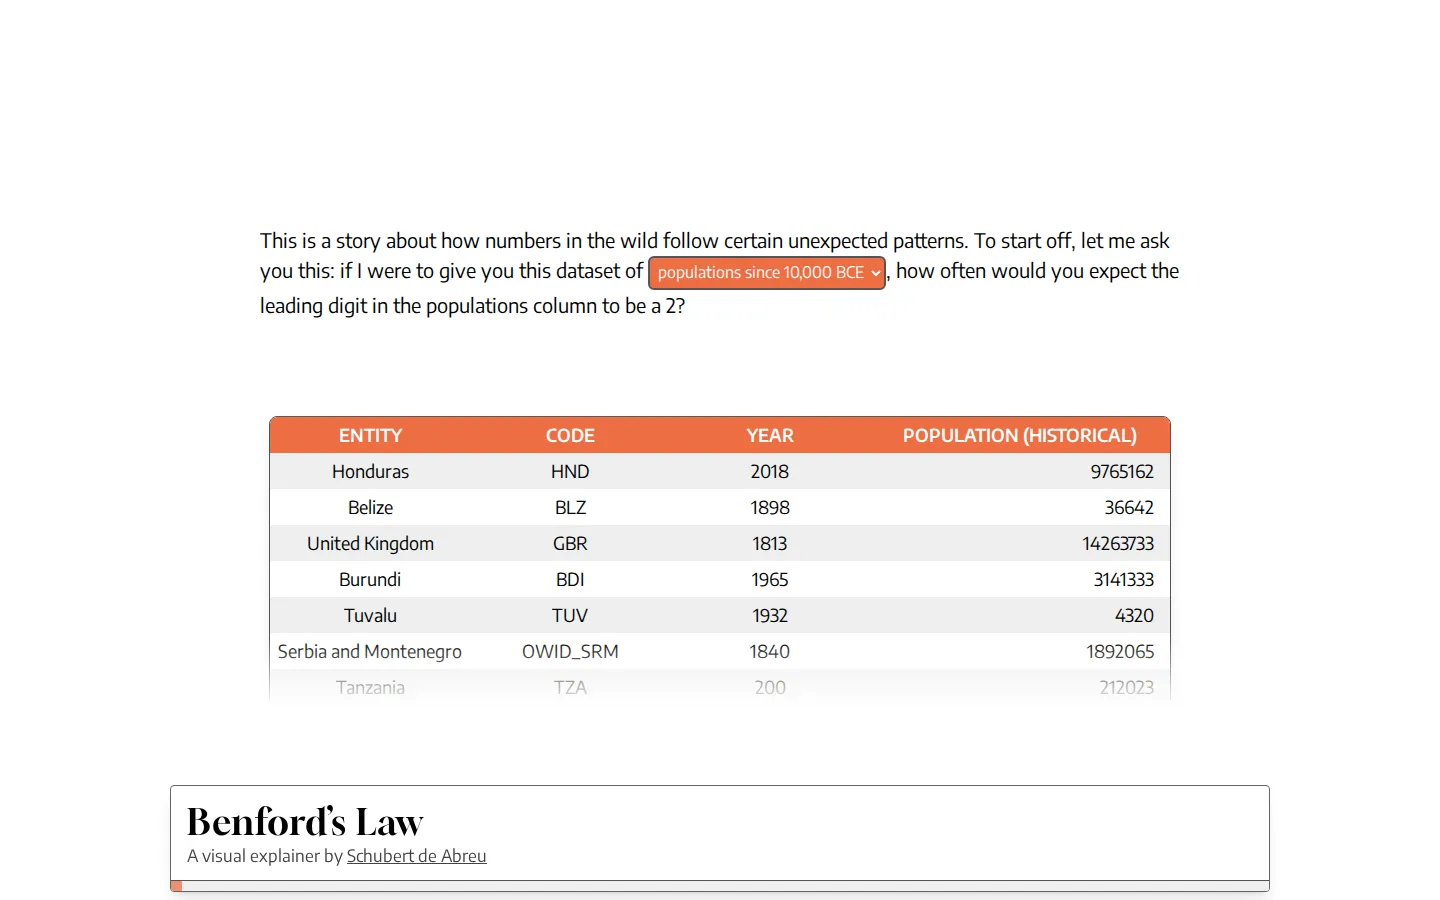
The page starts with a guessing game, placing ordinary datasets beside their leading-digit counts before naming the pattern. From there it moves through the formula, a compound-growth example, a guide to reading proportion plots, and a broad gallery of real data. Bar-chart and proportion-plot views offer two ways to inspect the same shape. The strongest turn comes later, when the explainer stops admiring the pattern and examines bad candidates: assigned numbers, narrow ranges, bounded measures, and undersized datasets. A methodology section then lays out the data collection and fit measures behind the charts.
What you can do there
- Follow the leading-digit explanation
- Compare real datasets with Benford's distribution
- Switch between bar charts and proportion plots
Why we picked it
A statistical curiosity can easily become a party trick, but this project keeps asking the next useful question. It explains the visual grammar before leaning on it, offers examples that both fit and misbehave, and clearly warns that a Benford mismatch cannot convict a dataset of fraud. The Pudding named it one of three 2025 Cup winners for good reason: the thoroughness is the feature.
How to get the most from it
Begin with the opening estimates instead of racing to the formula; the surprise lands better when you make a guess. Try both chart modes once the toggle appears, then give the limitations section equal time. If you are checking your own data, use this page to learn the questions to ask, not to issue a verdict.
Good to know
The story is long and chart-heavy. Its toggles, navigation, responsive layout, accessibility, motion, and audio were not exercised in this review, and no screenshot was captured. Most importantly, deviation from Benford's Law can have ordinary structural causes, so the project's fraud examples should be read as screening context rather than proof.
Who made it, and when?
Schubert de Abreu is the credited creator or organization.
Creator’s official page Open Benford's Law: A Visual ExplainerMore like this
The Pudding

Visual essays that use code, data, and interaction to explain culture unusually well.
Earth Nullschool

A living globe of wind, weather, ocean currents, and atmospheric motion.
The True Size Of…

Drag countries around the map and watch familiar size comparisons fall apart.
MapCrunch

Drop into a random street-level view somewhere in the world and figure out where you landed.